From the author of What School Could Be
and the producer of Most Likely To Succeed and Multiple Choice
aftermath
The Life-Changing Math
That Schools Won't Teach You
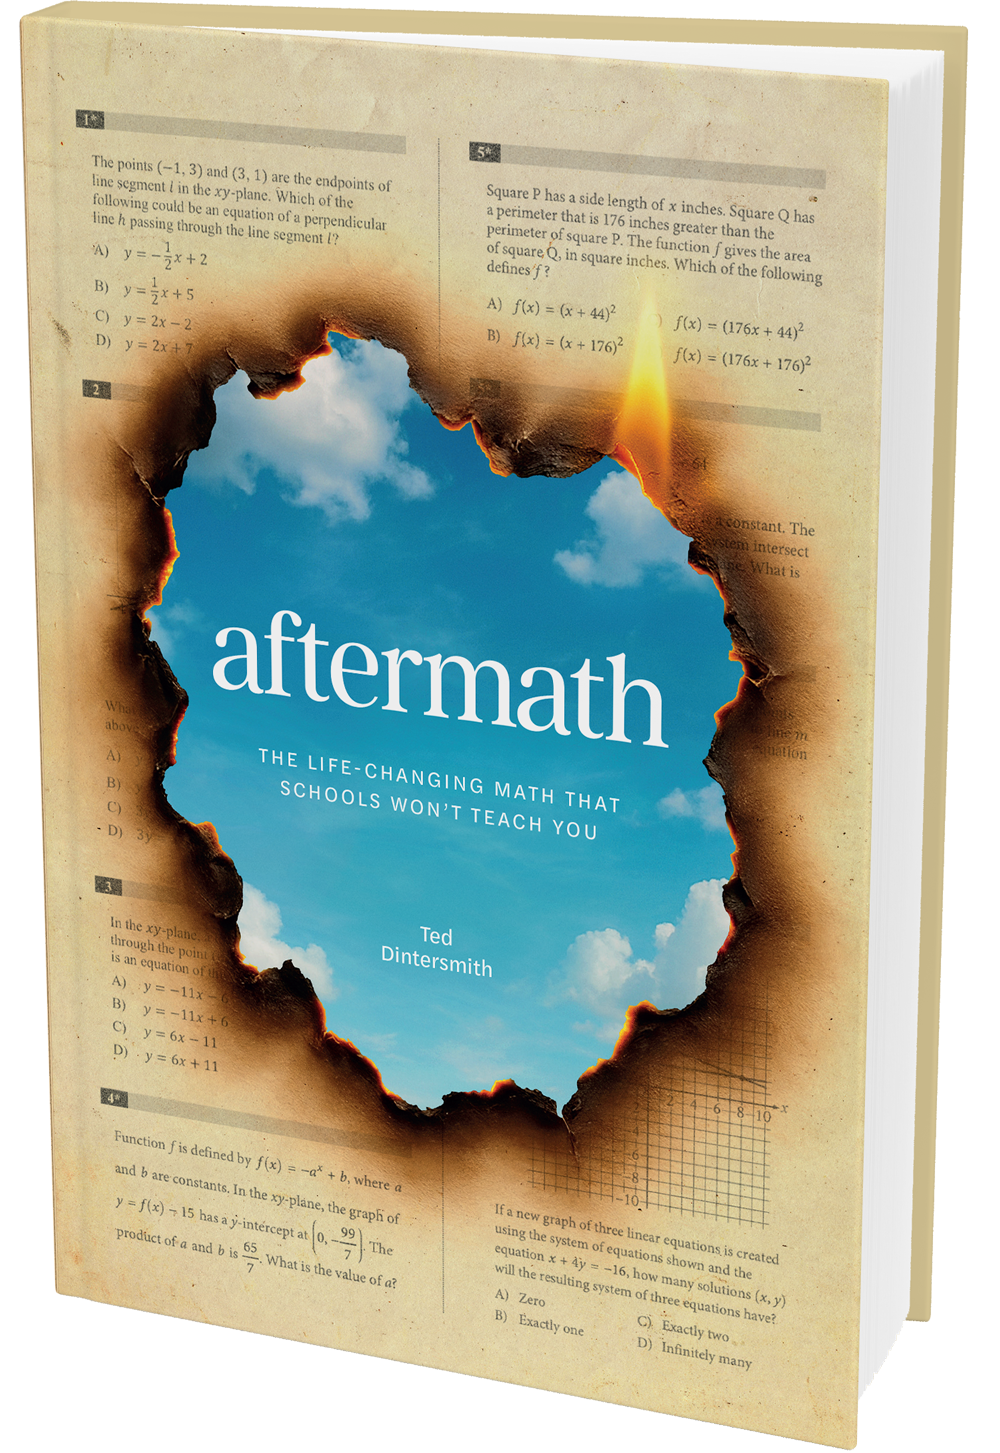
a new book by Ted Dintersmith
available everywhere now from
The Fast Company Press


"In the age of AI and data, we badly need to rethink the way we teach math in U.S. schools. Dintersmith has joyfully illustrated how we can pull the subject out of irrelevance in the eyes of our students — a must read for teachers and parents alike."
Steve Levitt, co-author
what they’re saying
about the book
Whether you loved or loathed high-school math, Aftermath will change how you think about math. And life. Math’s fascinating, powerful ideas. Explained with words and real-life examples — not abstract formulas and symbols. Ideas that are totally ignored in school, but essential to you and your loved ones.
from the author
“For years, something about math has vexed me. Math bubbles with powerful, fascinating, life-changing ideas. Yet few adults understand these ideas, or even know about them. Our collective math ignorance isn’t for lack of effort. We spend years on math in school, churning away on rote mechanics that few adults use, and smartphones handle flawlessly. The aftermath? America’s math confusion is jeopardizing the futures of millions, undermining civil society.”
- TED DINTERSMITH